
Financial ratios have always been a handy way for me to get a quick read on a company’s financial health. Whether you’re checking up on your own business or just reviewing a company you’re interested in, financial ratios break down complex data into clear pieces you can track over time. It’s pretty common for these ratios to high light issues before they turn into real head aches, which can give you a nice head start on problem solving. Here’s how I use financial ratios to spot trouble before it gets serious.
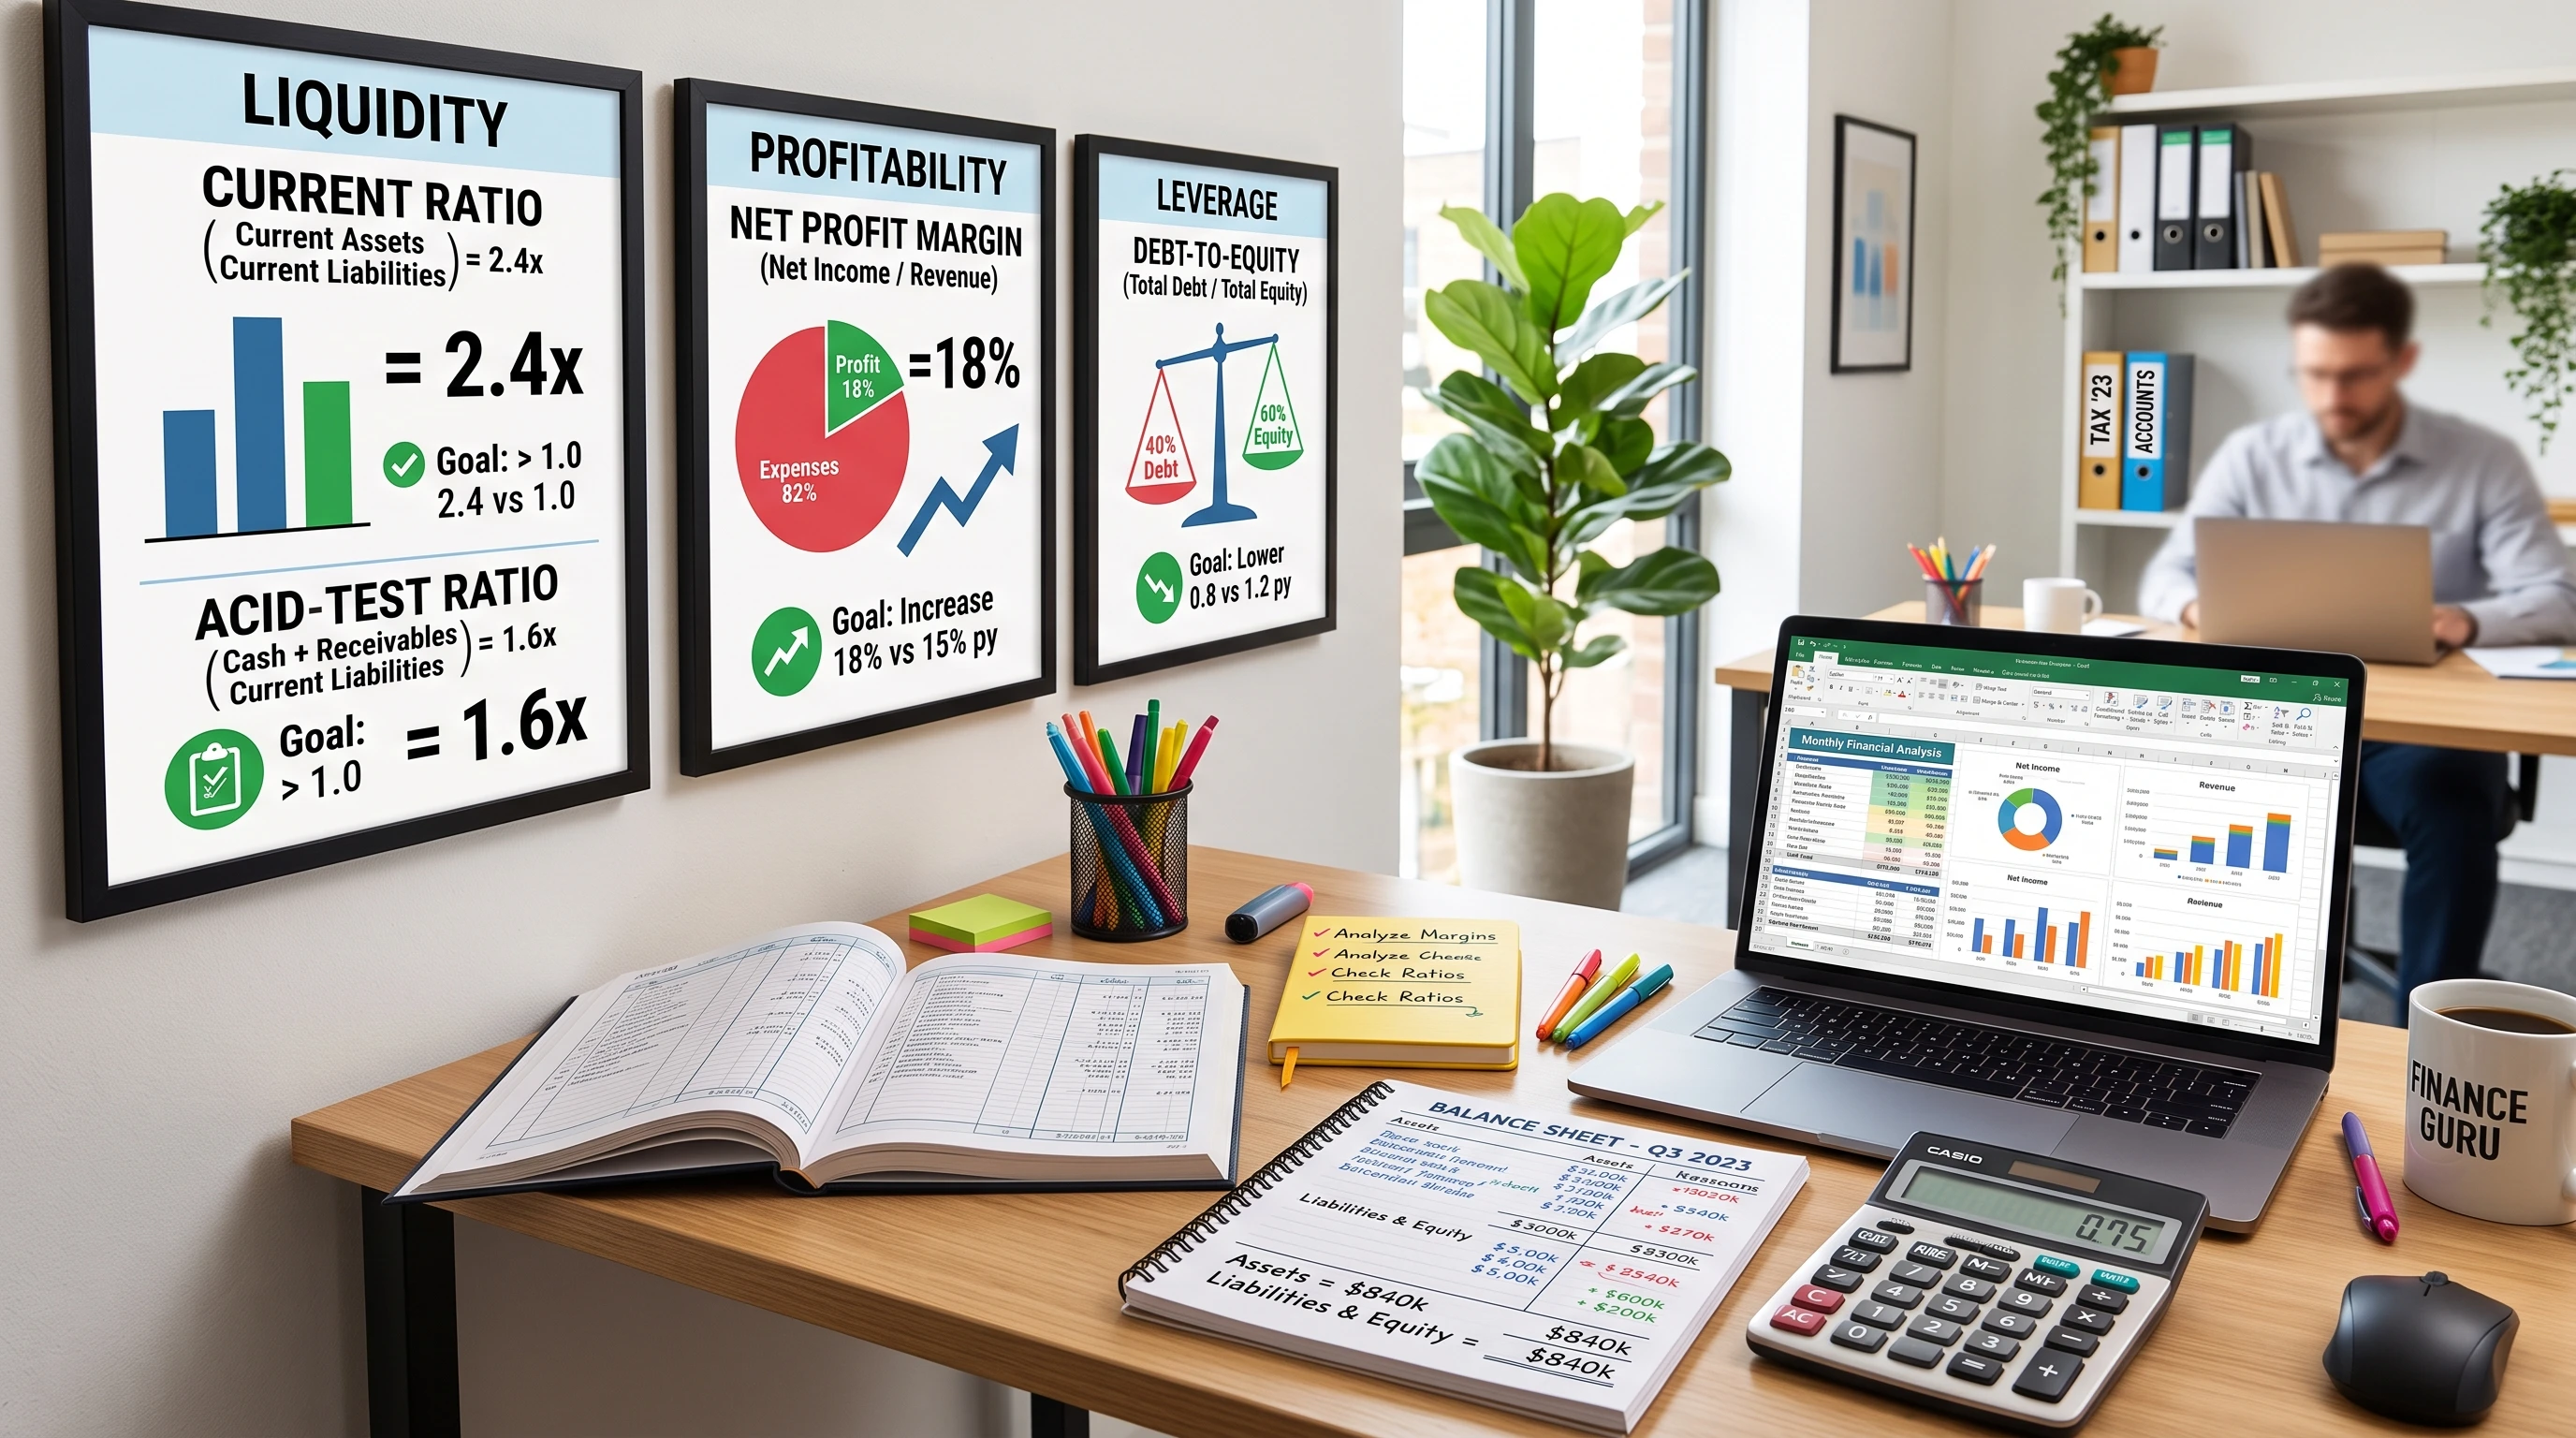
Why Financial Ratios Matter for Early Warning
Keeping tabs on financial ratios isn’t just for accountants. They’re a practical tool for business owners, investors, and even employees who want to keep an eye on a company’s direction. Ratios help you spot things like rising debt, slipping profits, or trouble collecting money from customers. These red flags might not show up immediately in general financial statements, but the ratios point them out early.
Most financial issues don’t happen all at once. There are usually signs that something is drifting off track before things get messy, which is why regularly reviewing financial ratios is so useful. Catching these signals early gives you more options, and a little more breathing room to address them.
Key Financial Ratios You Should Track
There are lots of different ratios out there, but I stick to a few basics that give me the clearest picture without getting bogged down in the weeds. Here are the ones I find really useful for spotting early warning signs:
- Current Ratio: This tells you if the business can cover its short term bills. You get it by dividing current assets by current liabilities.
- Quick Ratio (Acid Test): This is like the current ratio but only looks at the most liquid assets. It’s a faster check on short term health.
- Debt to Equity Ratio: This shows how much of the company’s financing is coming from debt. High or rising debt levels might signal trouble borrowing more or risk if sales drop.
- Gross Profit Margin: This reveals how much money is left after the cost of goods sold. If it’s falling, costs might be rising or prices dropping, which can be a danger zone for profits.
- Net Profit Margin: This is what’s left over after all expenses. A shrinking margin can be a hint that cost control or revenue growth is a problem.
- Accounts Receivable Turnover: This checks how efficiently the business collects from customers. If it’s slowing down, cash flow could be at risk.
- Inventory Turn Over: This ratio shows how quickly inventory sells. Slow turn over means cash is tied up or products aren’t moving.
Tracking these ratios regularly gives a straight forward look at financial health. Trends matter more than the numbers on their own; the direction they’re headed is what you really want to watch.
How to Calculate and Understand Key Ratios
Ratios sound technical, but the math is easy. Here’s a quick guide on how I calculate each ratio and what the results tell me:
- Current Ratio = Current Assets / Current Liabilities
If the ratio is below 1, the business doesn’t have enough liquid assets to cover what it owes soon. A ratio between 1.2 and 2 is usually comfortable for most small businesses. - Quick Ratio = (Current Assets – Inventory) / Current Liabilities
This one can dip lower than the current ratio, but still, anything under 1 could be risky if cash is tight. - Debt to Equity Ratio = Total Debt / Total Equity
Higher numbers mean more debt compared to owner investment. What’s reasonable can depend on the industry, but rising numbers are a red flag for anyone. - Gross Profit Margin = (Gross Profit / Sales) x 100
This is the percent of each dollar you keep after paying for products or materials. If it’s dropping over time, I check for rising supply costs or tougher competition driving prices down. - Net Profit Margin = (Net Profit / Sales) x 100
This catches all expenses. Falling net margins usually mean overhead is growing, or sales aren’t keeping up with expenses. - Accounts Receivable Turnover = Net Credit Sales / Average Accounts Receivable
If this ratio drops, collections are slowing. That means it might take longer to get paid, hurting cash flow. - Inventory Turnover = Cost of Goods Sold / Average Inventory
A lower ratio means inventory is sitting too long. That ties up cash and can lead to waste, especially with perishable goods.
I track these ratios each month, quarter, or year, depending on how fast the business moves. Regular tracking lets me see if something is changing and figure out what’s behind it. I have found it helpful to put the ratios in a trend analysis on a spreadsheet.
Early Warning Signs Hidden in Ratios
Once I’ve got the calculations done, I start watching for patterns. Here’s what I look out for when I’m trying to catch problems early:
- Slipping Liquidity: When the current or quick ratio drops over a few periods, cash could be running low. This is a sign to check if customers are slow to pay, or if bills are piling up.
- Rising Debt Levels: An increasing debt to equity ratio can signal that the business is leaning hard on loans just to keep moving. This could mean cash flow is tight, or sales are softening.
- Shrinking Margins: If gross or net profit margins are falling, something in costs or pricing has changed. Maybe suppliers are charging more, or customers need discounts. Both can eat into profits fast.
- Slow Collections: Falling accounts receivable turnover is a very direct hint that customers are dragging their feet. If the ratio dips, you want to tighten up collections before cash runs dry.
- Stale Inventory: Lower inventory turnover often points to products not selling as quickly as they used to. This can be due to changes in demand or even poor buying decisions.
No single number tells the whole story, but if multiple ratios start moving the wrong way together, it’s a pretty clear sign something’s off.
QuickBooks can make it easier to keep an eye on the financial information behind many important business ratios. By keeping income, expenses, assets, liabilities, and cash flow organized in one place, you can use its financial reports to identify unfavorable trends and potential problems before they become more difficult to correct. If you’d like a clearer picture of your business’s financial health, take a closer look at QuickBooks and see how it can help you stay on top of your numbers.
Biggest Mistakes to Avoid When Using Ratios
It’s tempting to rely just on the numbers, but ratios need context. The most common mistakes I see:
- Ignoring Industry Benchmarks: What’s normal for a fast growing tech firm isn’t normal for a family run retailer. Always compare ratios to similar companies to get a fair sense of what’s healthy or not.
- Forgetting to Track Trends Over Time: Looking at one month in a vacuum doesn’t help much. Consistent tracking is very important; this is where I’ve found problems show up before they get serious.
- Panicking Over Small Fluctuations: Every business has up and down months. Focus on the general direction, not the random zigs and zags.
- Only Looking at Ratios: Ratios are just part of the picture. Combining them with knowledge about the business, changes in the market, or one time events gives a much more complete view.
Tips for Setting Up Your Own Ratio Monitoring System
You don’t need fancy software to get real value from financial ratios. Here’s my simple approach:
- Choose a handful of key ratios that fit your business or the business you’re tracking. For most, the list above works fine.
- Plug the numbers into a spreadsheet monthly or quarterly. Most of what you need is in the balance sheet and income statement.
- Graph the ratios so you can spot trends easily. A quick upward or downward curve jumps out fast this way.
- Check ratios against industry averages a couple of times a year. Most industry groups or trade associations publish this info for free.
- Write down any big changes and notes on what caused them (new competition, higher costs, lost customers, etc.). It’s easy to forget why something changed if you don’t jot it down while it’s fresh.
If you want to go a step further, you can add a dash board to your spreadsheet or use free online templates. These visuals can make it much easier to monitor multiple ratios at once, alerting you if anything moves outside your usual range. It’s all about making it easy to spot changes early.
Common Questions About Using Financial Ratios
Here are a few things I get asked a lot about financial ratios and how they can help catch problems early:
Question: How often should I check financial ratios?
Answer: Monthly or quarterly works well for most businesses. If you’re in a very fast moving industry, monthly might be better. Once a year is usually not enough to spot early problems.
Question: What are the easiest ratios to start with?
Answer: I recommend the current ratio, gross profit margin, and debt to equity ratio for beginners. These give a quick overview and are simple to calculate.
Question: Where do I find the numbers for these ratios?
Answer: The balance sheet and income statement have everything you need. For turn over ratios, you’ll want to average the beginning and ending balances from each period.
Question: Do these ratios work for all businesses?
Answer: They work for most, but it’s a good plan to check ratios commonly used in your industry. Some sectors, like construction or real estate, use their own set due to how cash and revenue flow.
Question: What if a ratio looks off for just one period?
Answer: Occasional blips can happen, especially if there are special expenses or revenue adjustments. Focus on the trend over several periods rather than reacting to just one number.
Can You Trust What Financial Ratios Are Telling You?
Financial ratios are extremely useful, but they’re not infallible. Numbers can be affected by things like one off expenses, changes in accounting policy, or even basic mistakes on spreadsheets. Whenever I see a weird swing in one ratio, I double check the source data and poke around in the notes to financial statements (if they’re available).
Another thing to remember: ratios can flag potential issues, but you’ll often need more detail to dig out the real story. Something like rising debt to equity might be a problem, or it might just be a big investment in new growth. So I always pull in more info before jumping to conclusions. Talking to others in your industry, reviewing foot notes, and checking quarterly or annual management discussion reports can give you the extra context you need to spot what’s really happening behind the numbers.
You should also stay alert to the broader business environment. Changes like interest rate hikes, new market competitors, or shifts in customer demand can all impact your financial ratios even if your core business model hasn’t changed. Watching for these background factors helps you avoid over reacting to a blip that’s outside your control. The more you blend these outside details with your internal numbers, the clearer your overall picture becomes.
Putting It All Together: Using Financial Ratios for Peace of Mind
The best part about keeping an eye on financial ratios is the peace of mind it brings. It’s not about catching every single dip or spike but about seeing patterns before they become serious. I’ve used these ratios as quick reality checks for my own projects and in businesses I follow, and they have often highlighted problems early enough that fixing them was much less of a headache.
If you’re new to using financial ratios, don’t stress about getting everything perfect the first time. Even basic tracking gives more insight than ignoring the numbers altogether. With a little time and consistency, you’ll start spotting issues before they blow up; that’s a really good place to be. By sticking to consistent tracking, adding in context, and staying patient, you’ll be more likely to catch small issues before they get out of hand. Over time, you’ll grow more confident reading the numbers and using them to guide your business decisions. That way, ratios give you the edge to act early, avoid surprises, and keep your business on steady ground.
Here’s a little transparency: Our website contains affiliate links. This means if you click and make a purchase, we may receive a small commission. Don’t worry, there’s no extra cost to you. It’s a simple way you can support our mission to bring you quality “Business Planning content.”
When a small business sees several ratios moving in the wrong direction at once, what is the first practical step you recommend before making a major cut or taking on more financing? Short-term cash timing issues seem separate from things such as slow receivables and from deeper margin or demand problems before choosing the fix.
For seasonal businesses (ours is approaching peak season now), would you suggest comparing each month primarily with the prior month or with the same month last year? A simple ratio dashboard with trend lines and notes on unusual events could make those patterns much easier to interpret without overreacting to a single rough period.
Thanks for the comment.
If there are several ratios going the wrong way the first thing to check are the numbers that went into the ratio calculation. That would show any errors or if there are timing issues. Slow receivables is fairly easy to see and the fix isn’t that difficult.
For seasonal businesses look at the precious year’s trend analysis. That would be a better comparison. Definitely don’t over react.
This is a useful topic, especially for small business owners who may not notice financial problems until they become serious. I like the idea of using financial ratios as an early warning system rather than waiting for cash-flow problems to appear. One question I have is which ratios should a small business owner prioritize first if they are new to financial analysis? It would also be helpful to know how often these ratios should be reviewed to catch potential problems early.
Thanks for the comment.
The current Ratio, Net Profit Margin and Accounts Receivable Turnover are the three ratios to pay particular attention to. I recommend reviewing ratios monthly. Most accounting packages do the calculations automatically.